Capabilities Expertise:
1. Full Scan (MS)/Product ion scan (MS/MS) analysis of known or purified compounds (Solid/Liquid)
This can be used to identify the precursor ions that yield a product ion for a specific m/z ratio
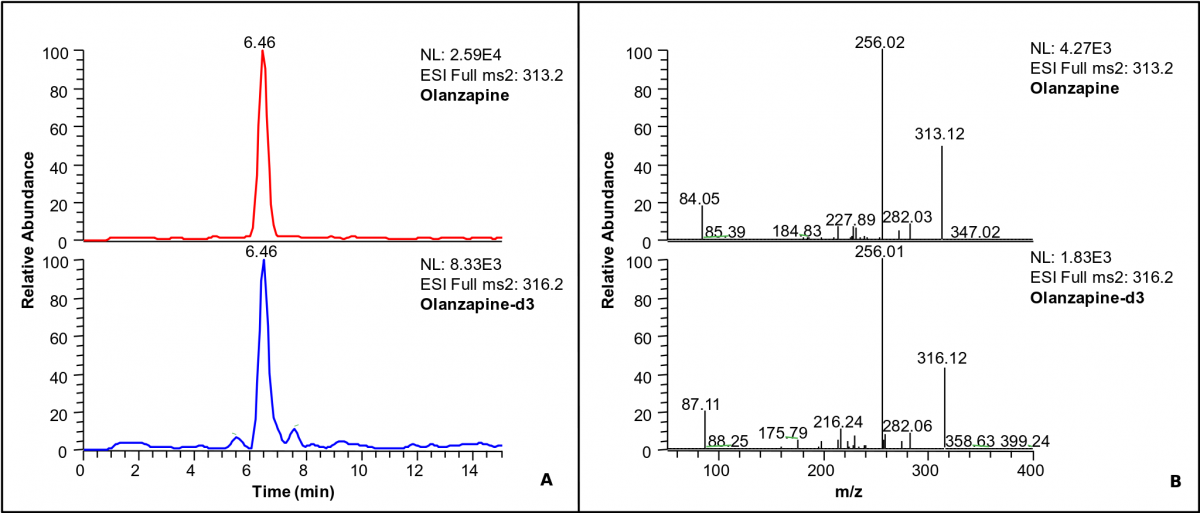
MS/MS analysis of Olanzapine. (A) UHPLC-MS chromatogram of standard (olanzapine) and
internal standard (olanzapine-d3) (B) MS/MS Spectrum of both standard (olanzapine ) and internal
standard (olanzapine-d3).
2. Analysis of compounds in biological matrix
(i) Extraction of metabolites (liquid-liquid extraction, Solid phase extraction or both, depending on the nature of the metabolite)
(ii) Analysis by Selected Reaction Monitoring (SRM) or Multiple Reaction Monitoring (MRM)
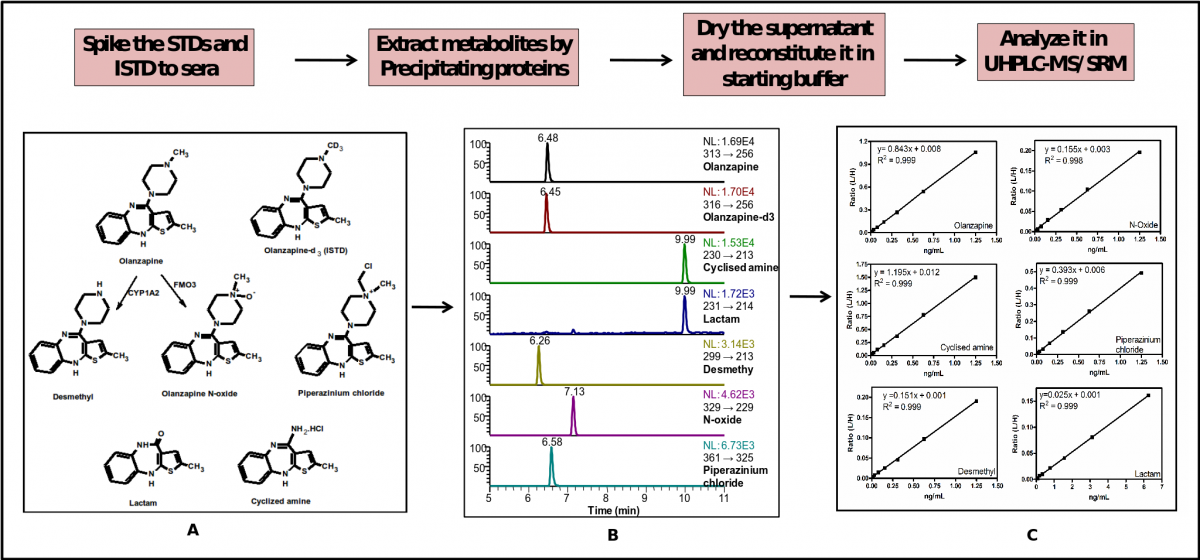
Absolute quantification of olanzapine and its metabolites using UHPLC-MS/SRM method. (A) Structures,
(B) UHPLC-MS/SRM chromatogram and (C) Standard curves for olanzapine and its metabolites.
3. Method development for specific metabolites to determine the absolute quantification
(i) MS scan, MS/MS scan and picking the most intense ion for the MRM scan
(ii) Spiking the standard and internal standard and extraction of metabolite from matrix (Sera, Saliva, Water, cell extract and Urine)
(iii) Detection of Limit of Detection (LOD) and Limit of Quantification (LOQ)
(iv) Construction of standard curve
(v) Validation of the method (Inter & Intraday variation, recovery, accuracy and precision)
(vi) Sample analysis
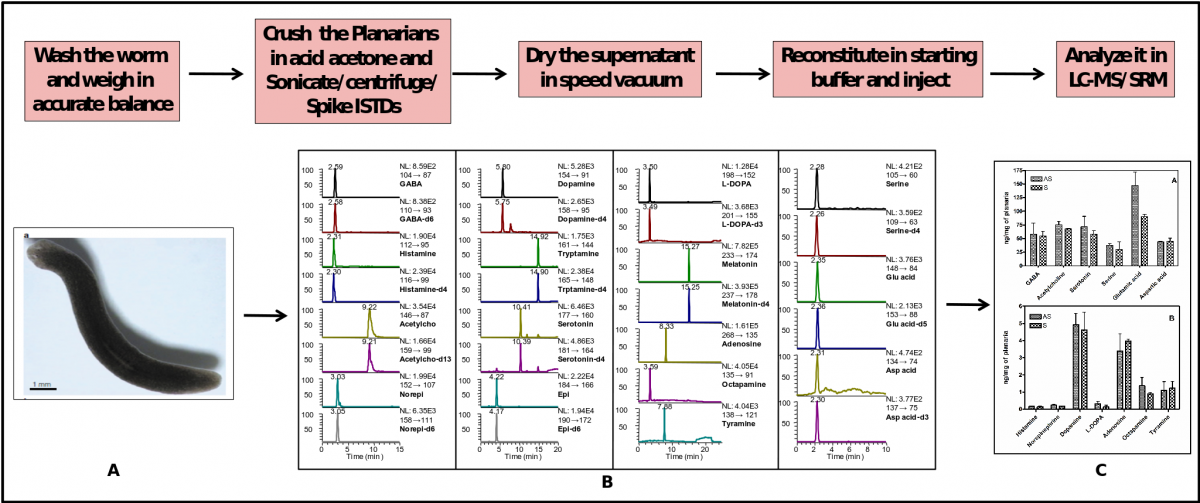
Absolute quantification of neurotransmitters from planarian extract using UHPLC-MS/SRM method.
(A) Picture of the intact planaria, (B) UHPLC-MS/SRM chromatogram of neurotransmitters standards and
internal standards and (C) comparison of neurotransmitters between sexual and asexual planaria.
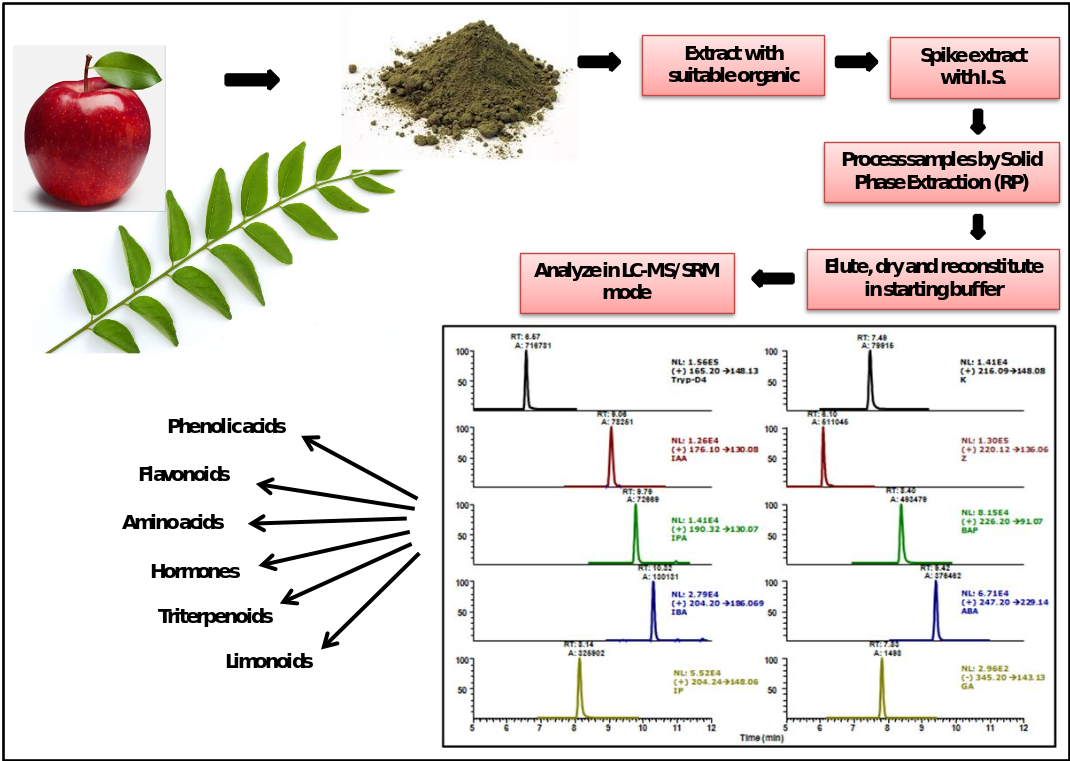
4. Quantification of metabolites from plant extracts
Quantification of metabolite from plant extracts (dry powder from plant materials) using UHPLC-MS/SRM method
5. Metabolite Profiling/Comparative Metabolomics
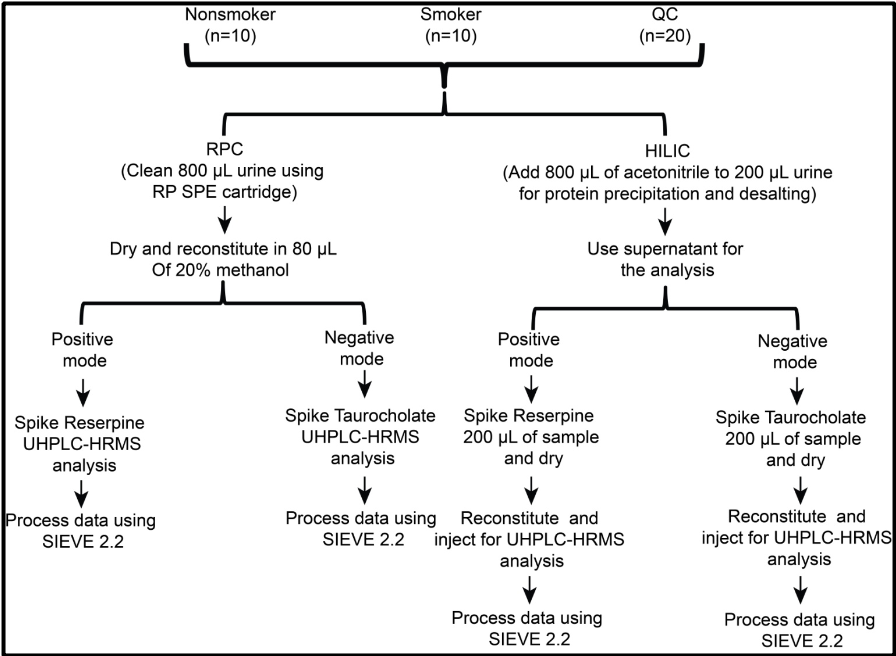
Using Q-Exactive HRMS system we can now do the comparative metabolite profiling (Hydrophobic-reverse phase and Hydrophilic-HILIC) between control versus sample. The data analysis will be done using SIEVE 2.2 software using publically available data bases like HMDB and KEGG through Chemspider search.
Metabolite profiling workflow to analyze urine samples from nonsmokers and smokers. Samples were
prepared for two chromatographic separations and also for two ionization modes. Data analysis was carried out with SIEVE 2.2.
As part of the 'omics' technology platforms, C-CAMP via its collaborators also offers following services:
1. Data visualisation and reporting: After initial processing by the vendor specific software platforms, expertise can be availed for data cleaning, data transformations, statistical evaluations, visualisations, modelling and reporting
2. Interactive visualisation and analysis via web application/dashboards. (For demo, visit https://www.sirpi.io/omicsvisdec)
3. Training on using the R programming packages : ready, tidyr, dplyr, ggplot2, plotly and the shiny package.
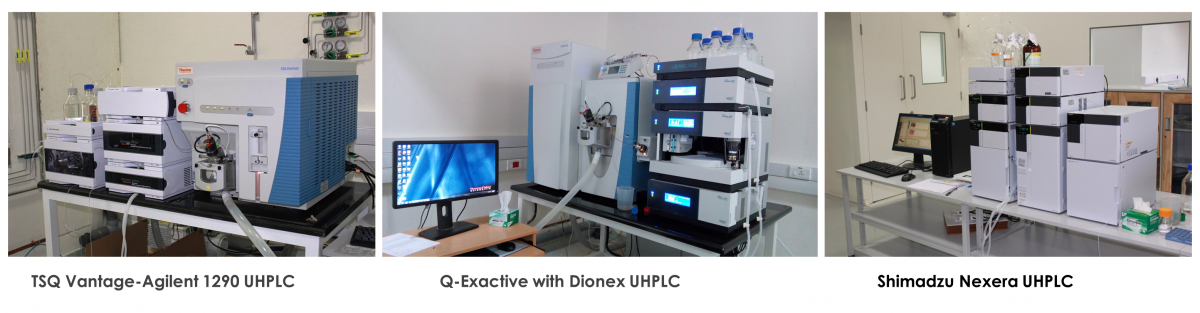
Instruments
Methods Developed
|
Quantitative Metabolomics
|
|
S. No.
|
Compound Class
|
No.
|
Metabolites |
|
1
|
Neurotransmitters
|
17
|
Histidine, Serine, Histamine, Aspartic acid, Glutamic acid, GABA, Nor-epinephrine, Dopa, Epinephrine, Octopamine, Tyrosine, Dopamine, Serotonin, Tyramine, Melatonin, Tryptophan, Tryptamine
|
|
2
|
Amino acid Panel
|
24 |
Histidine, Serine, Asparagine, Arginine, Aspartic acid, Glutamic acid, Threonine, Alanine, Proline, Tyrosine, Lysine, Methionine, Valine, Phenylalanine, Isoleucine, Tryptophan, Leucine, Taurine, Sarcosine, Citrulline, Ornithine, Homoserine, Aminoadipic acid, Hydroxyproline
|
|
3
|
Amines
|
37
|
Combination of Amino acids and Neurotransmitter Panels
|
|
4 |
Cholic acids Panel |
14 |
GUDCA, GCA, TUDCA, TCA, CA, UDCA, GCDCA, GDCA, TDCA, GLCA, TLCA, CDCA, DCA, LCA
|
|
5
|
Nucleotides
|
4
|
|
|
6
|
Thiols
|
7
|
|
|
7
|
Plant Growth Hormones
|
13
|
Zeatin, Benzyl-aminopurine, Indole acetic acid, Indole propionic acid, Indole butyric acid, Gibberellic acid, Abscisic acid, Isopentenyl adenine, Salicylic acid, Jasmonic acid
|
|
8
|
Isoflavanoids and Phenolic acids
|
23
|
Quinic acid, Gallic acid, Chlorogenic acid, Catechin, Caffeic acid, Epicatechin, Epigallocatechin 3-gallate, umbelliferone, Liquiritin, Isovitexin, Isoquercetin, Genistin, Astragalin, Ononin, Luteolin, Quercetin, Naringenin, Kaempferol, Formononetin, Galangin, Licochalcone A, Glabridin
|
|
9
|
Plant Metabolites
|
9
|
Tulasi (Ocimum sanctum) and Neem (Azdirachta indica) Metabolites |
|
10
|
Amyrins
|
2
|
|
|
11
|
Colistin from Sera
|
1
|
|
|
12
|
Olanzapine Metabolites
|
5
|
|
|
13
|
Folates
|
5
|
|
|
Metabolite Profiling
|
|
1
|
Comparative Metabolomics
|
Metabolite Profiling from Urine |